At Yorb, we have over 10 years experience in providing both bespoke and generic digital solutions for the environment. Our solutions portfolio includes the following application types:
At Yorb, we have over 10 years experience in providing both bespoke and generic digital solutions for the environment. Our solutions portfolio includes the following application types:
 The
River Analysis Package (RAP) is a toolbox of quantitative techniques to
help river managers, scientists and consultants manage environmental
flows. RAP has three main modules:
The
River Analysis Package (RAP) is a toolbox of quantitative techniques to
help river managers, scientists and consultants manage environmental
flows. RAP has three main modules:
Hydraulic Analysis (HA)
Allows user to examine hydraulic characteristics of river channels.
Interactive visualisation features make it easy to explore hydraulic
conditions at channel cross-sections. It can calculate the standard
cross-sectional attributes (surface width, area, hydraulic radius,
wetted perimeter, etc.); define habitat criteria and calculate the area
of habitat at a range of discharges. The HA module can read HECRAS
output files or users can enter their own channel geometry data.
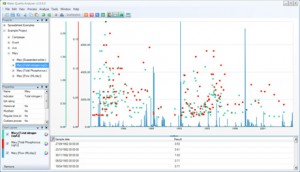
Time Series Analysis (TSA)
This module allows users to calculate summary metrics of daily discharge
data, however it can handle other forms of time series data such as
time series hydraulic data output from the HA module (above). TSA can
present summary statistics based on the entire period of record,
annually, seasonally, or monthly depending on the specific issue being
investigated. Analysis methods include spell analysis, rates of
hydrograph rise and fall, the prediction of flood return interval
(partial and annual series), baseflow (Lyne and Hollick), seasonality
(Colwells and Haines methods). In addition to the numeric output, the
TSA module has some neat visualization tools for plotting flow duration
curves, flood frequency curves, and baseflow vs floodflow.
Time Series Manager (TSM)
This solution was developed initially under the Cooperative Research
Centre for Catchment Hydrology and was further developed as part of the
eWater Cooperative Research Centre’s Ecological Management program.
RAP’s underlying algorithms are utilised by a number of other eWater CRC
products.
RAP is available for download, free of charge, from the eWater CRC’s Toolkit website:
http://www.toolkit.net.au/rap/
 This solution is a collection of tools for analysing water quality data. It has several major modules:
This solution was developed as part of the eWater Cooperative Research Centre’s Ecological Management program in collaboration with the Queensland Department of Natural Resources and Mines.
Water Quality Analyser can be purchased from eWater:
http://www.ewater.com.au/products/ewater-toolkit/eco-tools/water-quality-analyser
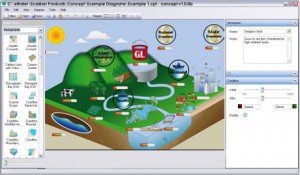
Create dynamic conceptual diagrams
Concept is a tool for creating dynamic conceptual diagrams. It is a drawing package that allows the user to display the important elements of a scenario in a visually appealing way and to show the links between these elements. The links can have relationships associated with them and these relationships can be changed dynamically to show changed conditions for the elements under different scenarios. The software can be used to model just about any situation for purposes ranging from communicating processes and scenarios to stakeholders, to consensus building, issues scoping and prioritising.
This solution was produced in collaboration with the eWater Cooperative Research Centre
http://www.toolkit.net.au/concept
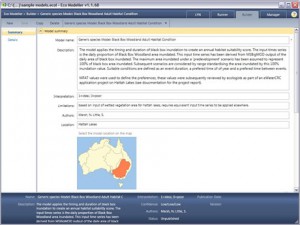
The Model Builder screen allows users to enter a model’s function and associated metadata
Eco Modeller is a tool for building, storing, running and sharing quantitative models of ecological responses to physical and biological factors. It allows for the merits of alternative natural resource management scenarios to be compared, such as the ecological consequences of different watering scenarios on biota. Eco Modeller provides a flexible platform for building ecological response models of many forms. It can be applied to both aquatic and non-aquatic scenarios, where time series data is available.
This solution was developed for the eWater Cooperative Research Centre as part of their Ecological Management program.
This solution is available for download, free of charge from the eWater CRC’s Toolkit website:
http://www.toolkit.net.au/eco-modeller/
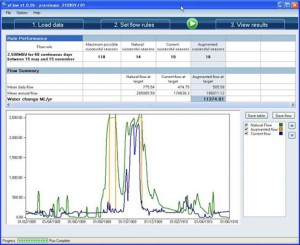
The Results screen displays how successful flow regimes are at meeting flow requirements as well as the total volume of additional water required
eFlow Predictor assists with the design of environmental flow regimes by augmenting current flow regimes to meet environmental flow requirements (e.g. seasonal base flows and event-based floods). It allows the simultaneous consideration of many environmental flow requirements and enables the use of different augmentation strategies such as extending existing high flows, mimicking the natural frequency of specific flow requirements and allowing multi-year return periods. This solution includes the option of defining ‘risk based’ environmental flow criteria to allow the assessment of those years where environmental conditions are not quite met, although some environmental value has still been achieved. eFlow Predictor provides a measure of the water cost of delivering the environmental flow components, as well as a time series of the augmented flow.
This solution was developed as part of the eWater Cooperative Research Centre’s Ecological Management program.
eFlow Predictor is available for download, free of charge, from the eWater CRC’s Toolkit website:
http://www.toolkit.net.au/eflow-predictor/
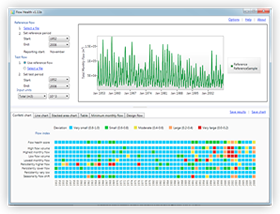
Assess and design flow regimes for optimum flow health
A tool to assist with the assessment, design and management of river flow regimes. Its main purpose is to provide a score for hydrology in river health assessments, but it can also be used as a tool to assist environmental flow regime design. It has three main functions:
This solution was developed in collaboration with Fluvial Systems as part of the International Water Centre’s River Health and Environmental Flow in China Project
The Flow Health Hydrology Assessment Tool is available for download, free of charge, from the International Water Centre (IWC):
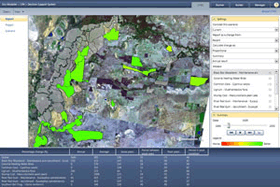 A
decision support tool for assessing the condition of wetland assets in
the Lower Murrumbidgee River Floodplain including the Yanga National
Park and the Nimmie-Caira system. Based on the Eco Modeller Framework,
LYNC compares the responses of species to physical or biological drivers
(e.g. flow) under different scenarios. It adds an extra dimension to
Eco Modeller through the custom LYNC reporting interface. LYNC employs
aggregation techniques, based on user-defined weightings, and spatial
visualisation to communicate results that are meaningful to users at
different levels. That is, the condition of wetland assets and species
and the relative improvements and declines for different flow scenarios
can be reported over both space and time, at the whole-of-system level
or for a single species or location.
A
decision support tool for assessing the condition of wetland assets in
the Lower Murrumbidgee River Floodplain including the Yanga National
Park and the Nimmie-Caira system. Based on the Eco Modeller Framework,
LYNC compares the responses of species to physical or biological drivers
(e.g. flow) under different scenarios. It adds an extra dimension to
Eco Modeller through the custom LYNC reporting interface. LYNC employs
aggregation techniques, based on user-defined weightings, and spatial
visualisation to communicate results that are meaningful to users at
different levels. That is, the condition of wetland assets and species
and the relative improvements and declines for different flow scenarios
can be reported over both space and time, at the whole-of-system level
or for a single species or location.
This solution was developed as part of a joint project with eWater and Sinclair Knight Merz for the NSW Department of Environment, Climate Change and Water (DECCW).
This solution is used in-house by DECCW and is not available to the public.
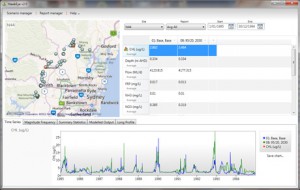
Hawkeye allows users to assess the performance f ecological assets under different scenarios through time across multiple defined locations
A custom reporting tool for assessing the performance of ecological assets (locations) under different scenarios (flow, salinity, temperature, etc.). Hawkeye processes the outputs of physical process models to produce series of flow and constituents through time across many locations. The reporting interface allows users to view summary metrics and visualisations associated with each of the physical drivers.
This solution is being developed for Sydney Water in collaboration with eWater and SKM
Hawkeye is an in-house application used by Sydney Water and is not available for public use.
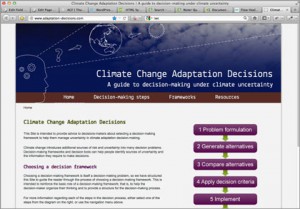 A
website intended to provide advice to decisions-makers about selecting a
decision-making framework to help them manage uncertainty in climate
adaptation decision-making. The site is database driven with a custom
themed Content Management System.
A
website intended to provide advice to decisions-makers about selecting a
decision-making framework to help them manage uncertainty in climate
adaptation decision-making. The site is database driven with a custom
themed Content Management System.
This website was commissioned by the National Climate Change Adaptation Research Facility (NCCARF).

34 Ridge Street
Highgate Hill Q 4101
ph +61 7 3255 2238
email info@yorb.com.au